

New Filtering Pattern
TestOps Gen 3
Background
With the TestOps Gen 3 redesign, our goal was to enhance the platform’s capabilities for enterprise users, improving both functionality and user experience. As part of this transformation, we revisited our reporting system—not just visually but from a usability and clarity perspective. Reports needed to provide users with meaningful insights while allowing them to efficiently refine and analyze data.
Filtering plays a crucial role in this process, enabling users to narrow down data, identify trends, and make informed decisions. However, the previous filtering experience had limitations in discoverability, consistency, and flexibility. To address these issues, we set out to define a scalable and intuitive filtering pattern that aligns with enterprise users’ evolving needs.
Design Process
Evaluate the Current Filtering Behavior
The more seamless the filtering interaction, the more cognitive energy users can dedicate to analyzing their ideal results. Together with Product Managers, we conducted an evaluation of the Gen 2 filtering behavior to identify areas for improvement.
We gathered all relevant filtering use cases for TestOps Gen 3 to determine essential functionalities. We also collaborated with the engineering team to understand performance issues with the current filtering system. Additionally, we conducted user interviews to identify pain points, challenges and how users interact with filters to uncover areas for improvement.
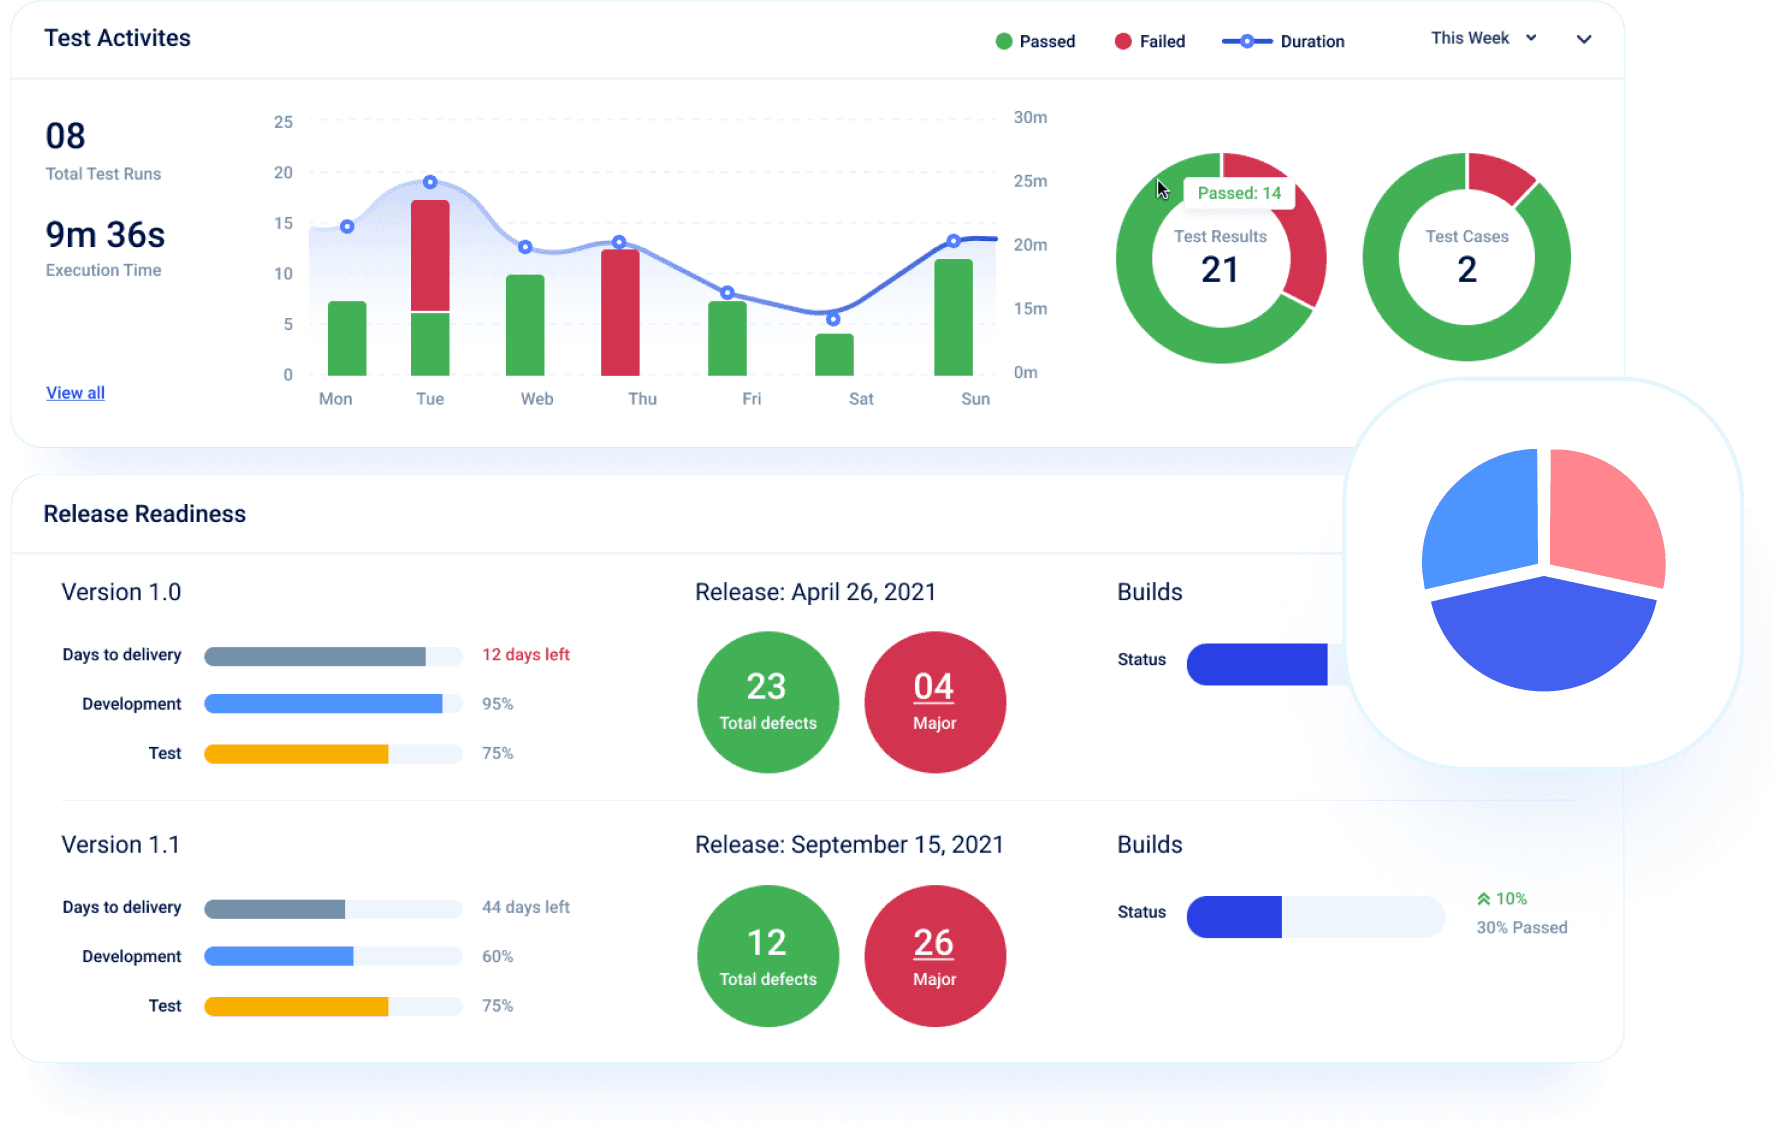
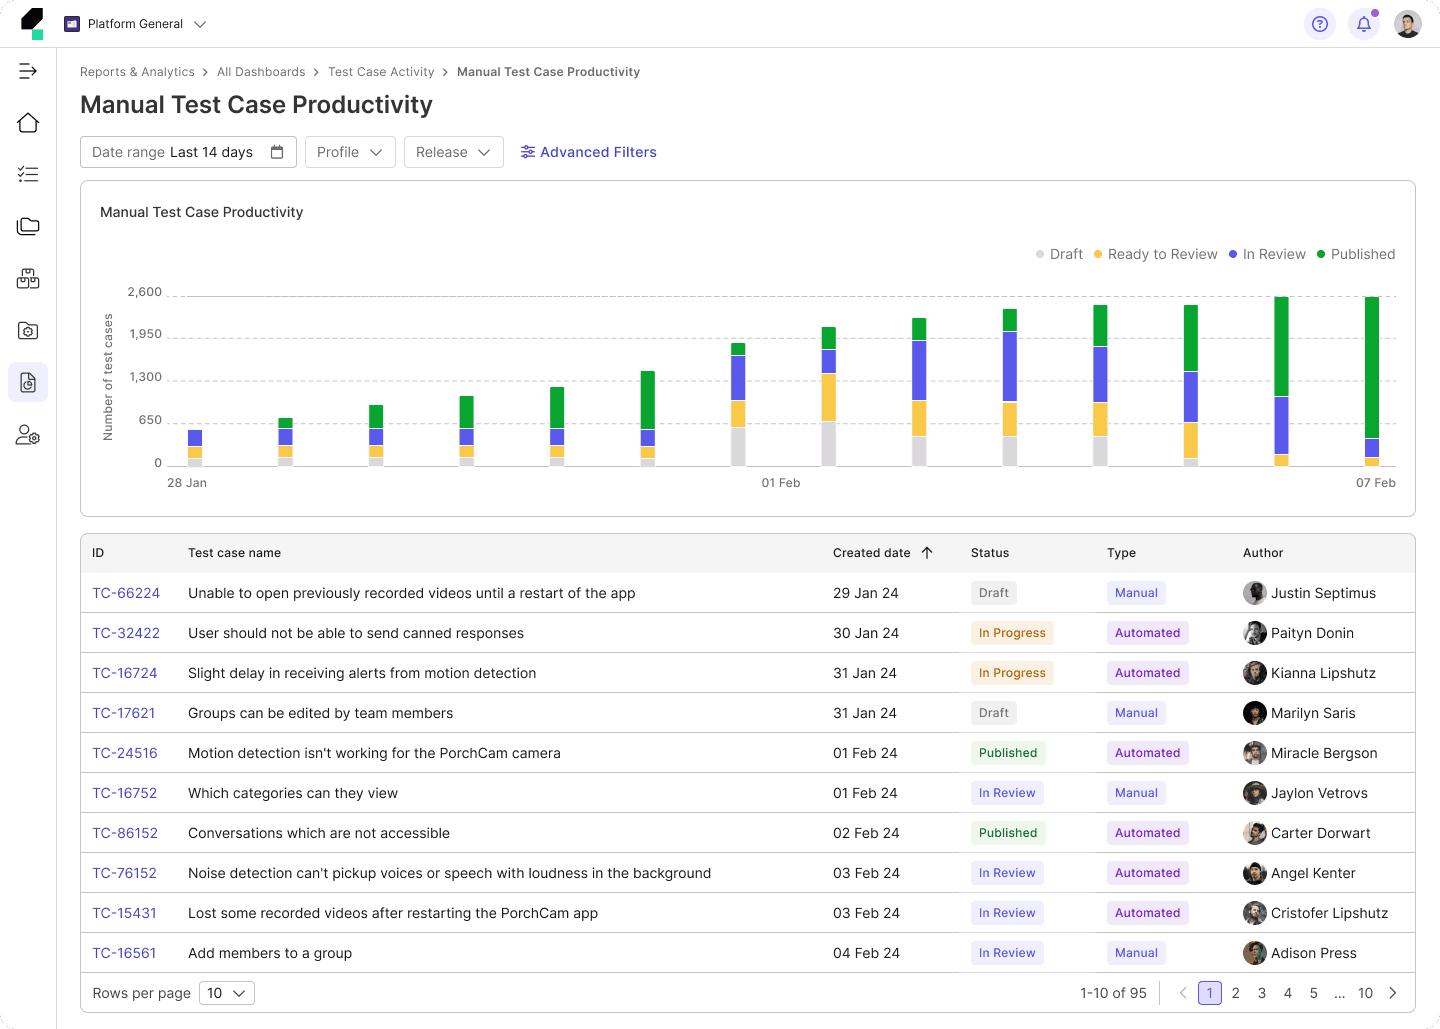
The old experience:
We identified the following issues with the current filtering behavior:
Performance Issues
The current filtering system updates instantly after each selection, leading to slow performance and forcing users to wait after every choice, disrupting their workflow.
Inefficient Filtering Process
Users typically apply a set of conditions rather than a single filter at a time, making the current approach inefficient for their workflow.
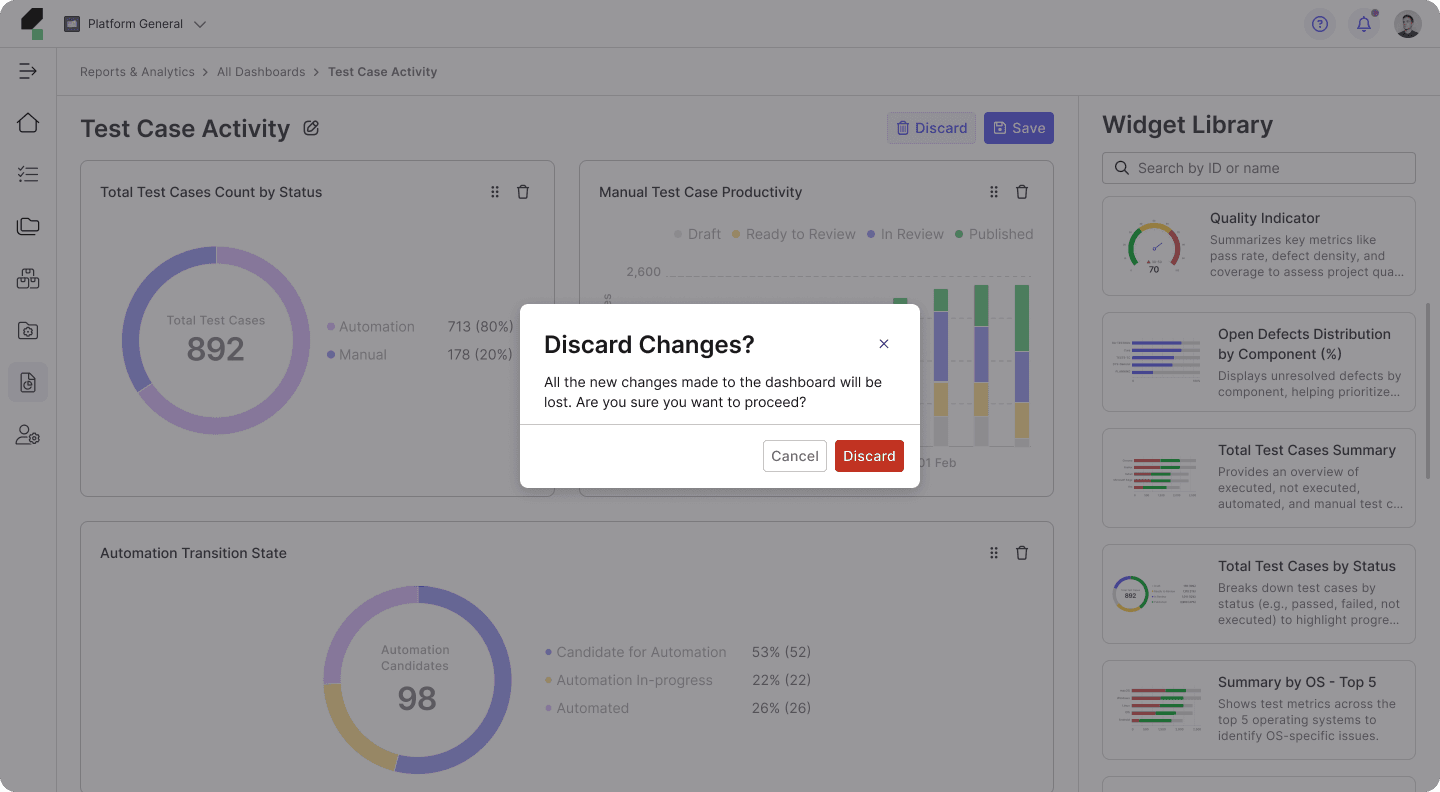
Layout Breaks
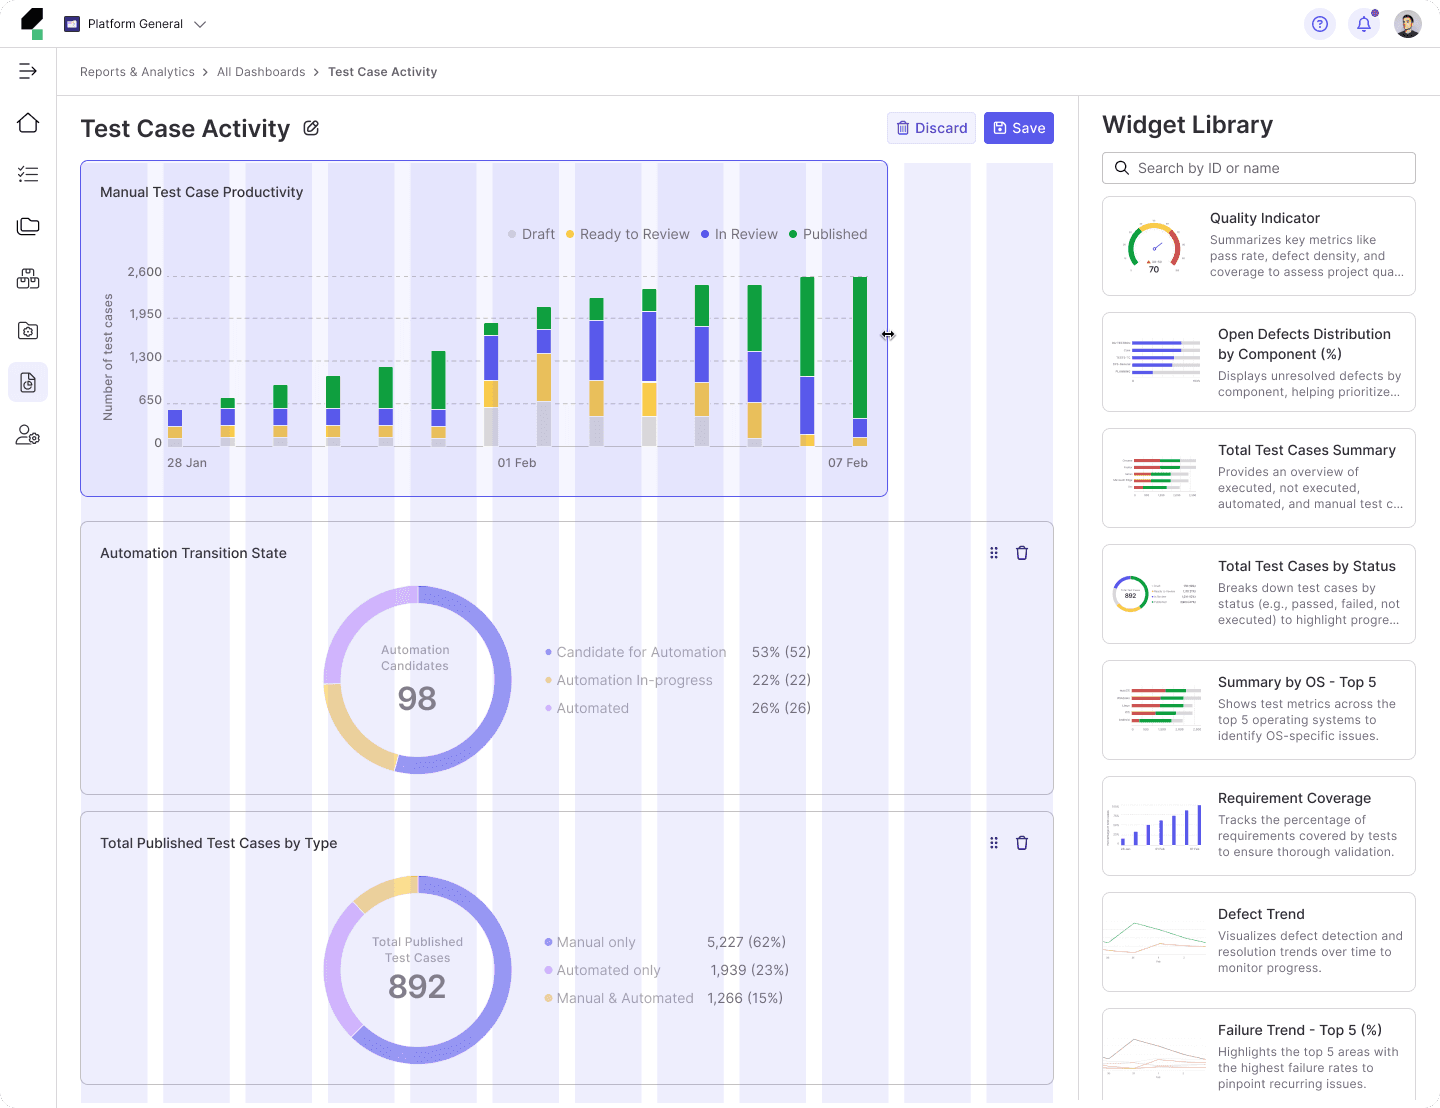
Applying multiple filters pushes the chart down, disrupting the layout and shifting focus away from the primary working area.
Competitor Analysis and Best Practices Research
I explored filtering patterns from other data-heavy platforms and analytics tools such as GitLab, Sentry, BrowserStack, and Cypress to understand current practices in handling complex filtering interactions. I also researched filtering behavior through articles from UX-focused platforms.
Additionally, I evaluated Superset’s capabilities, which Katalon uses as a library for chart development, to ensure our approach aligns with technical constraints while also identifying areas for improvement.
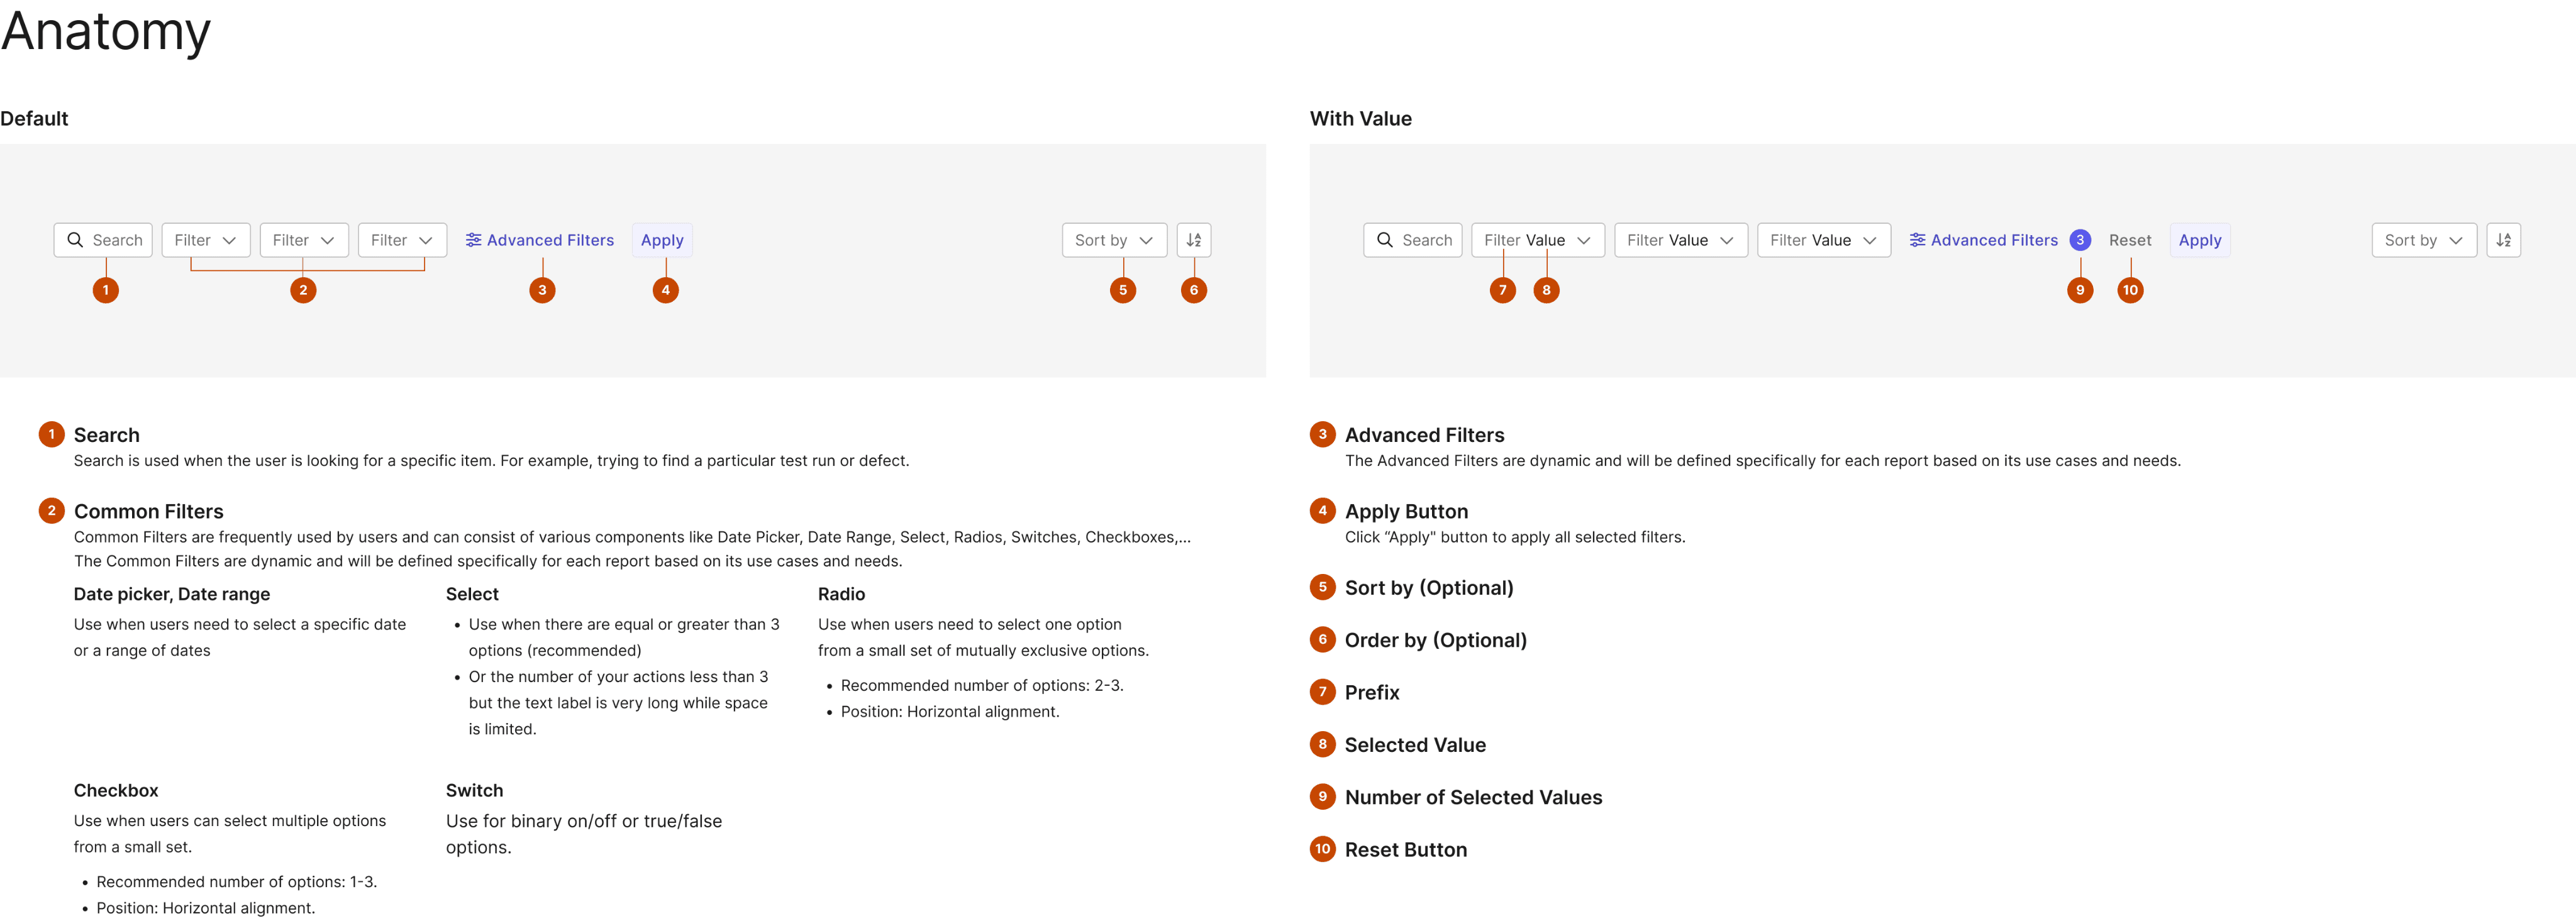
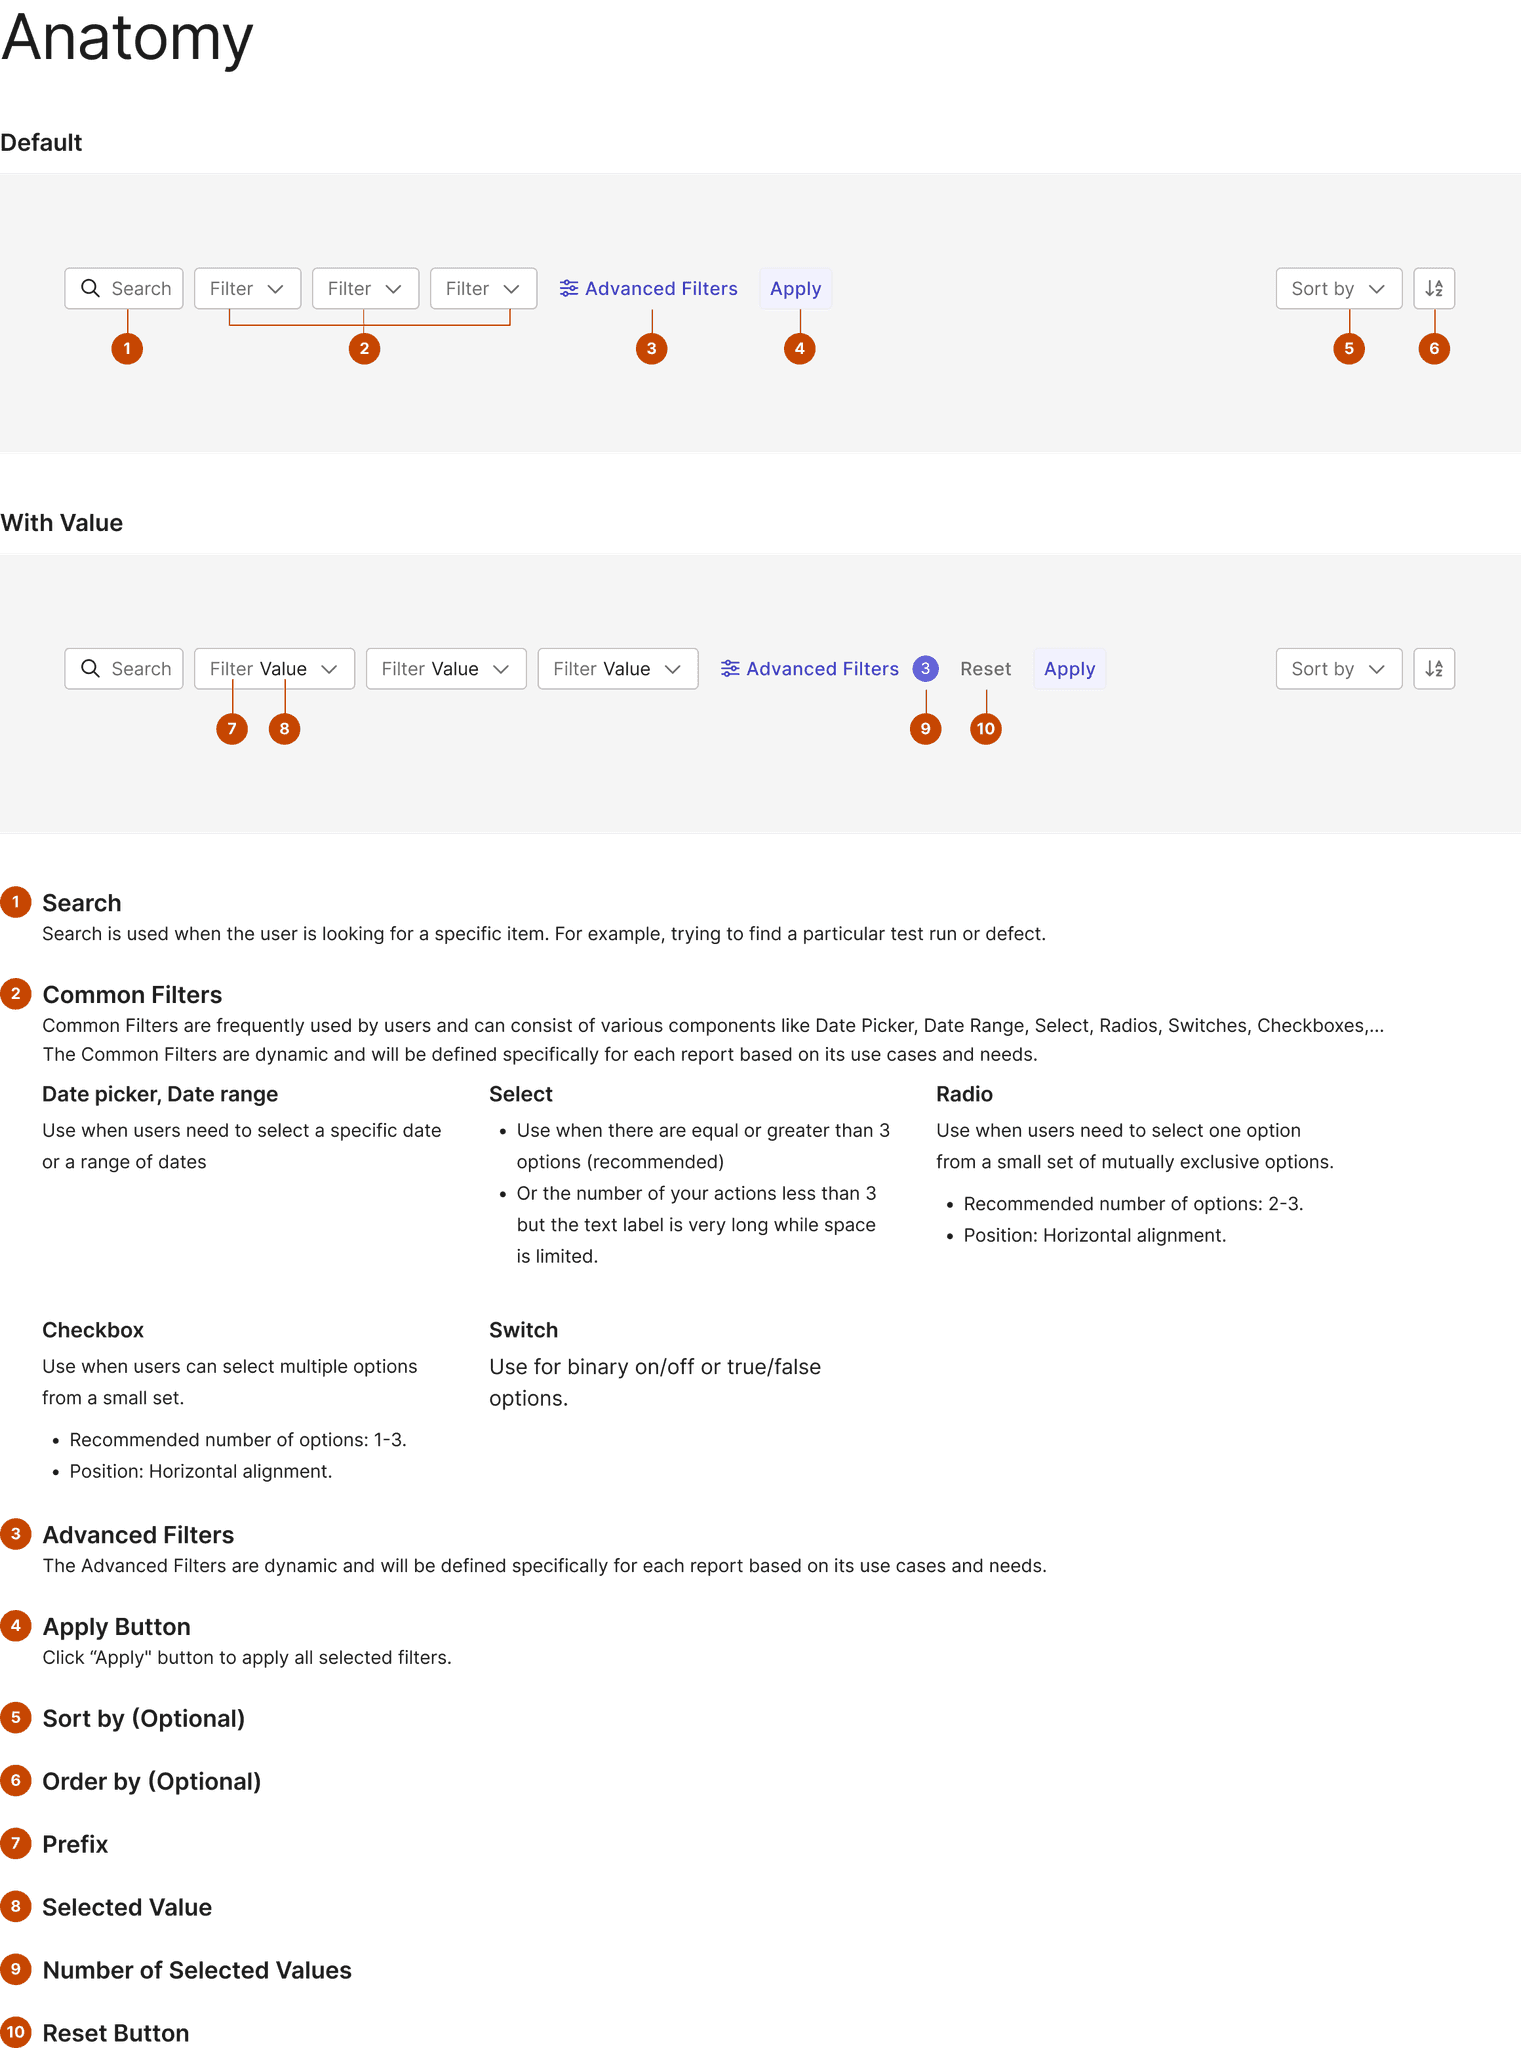
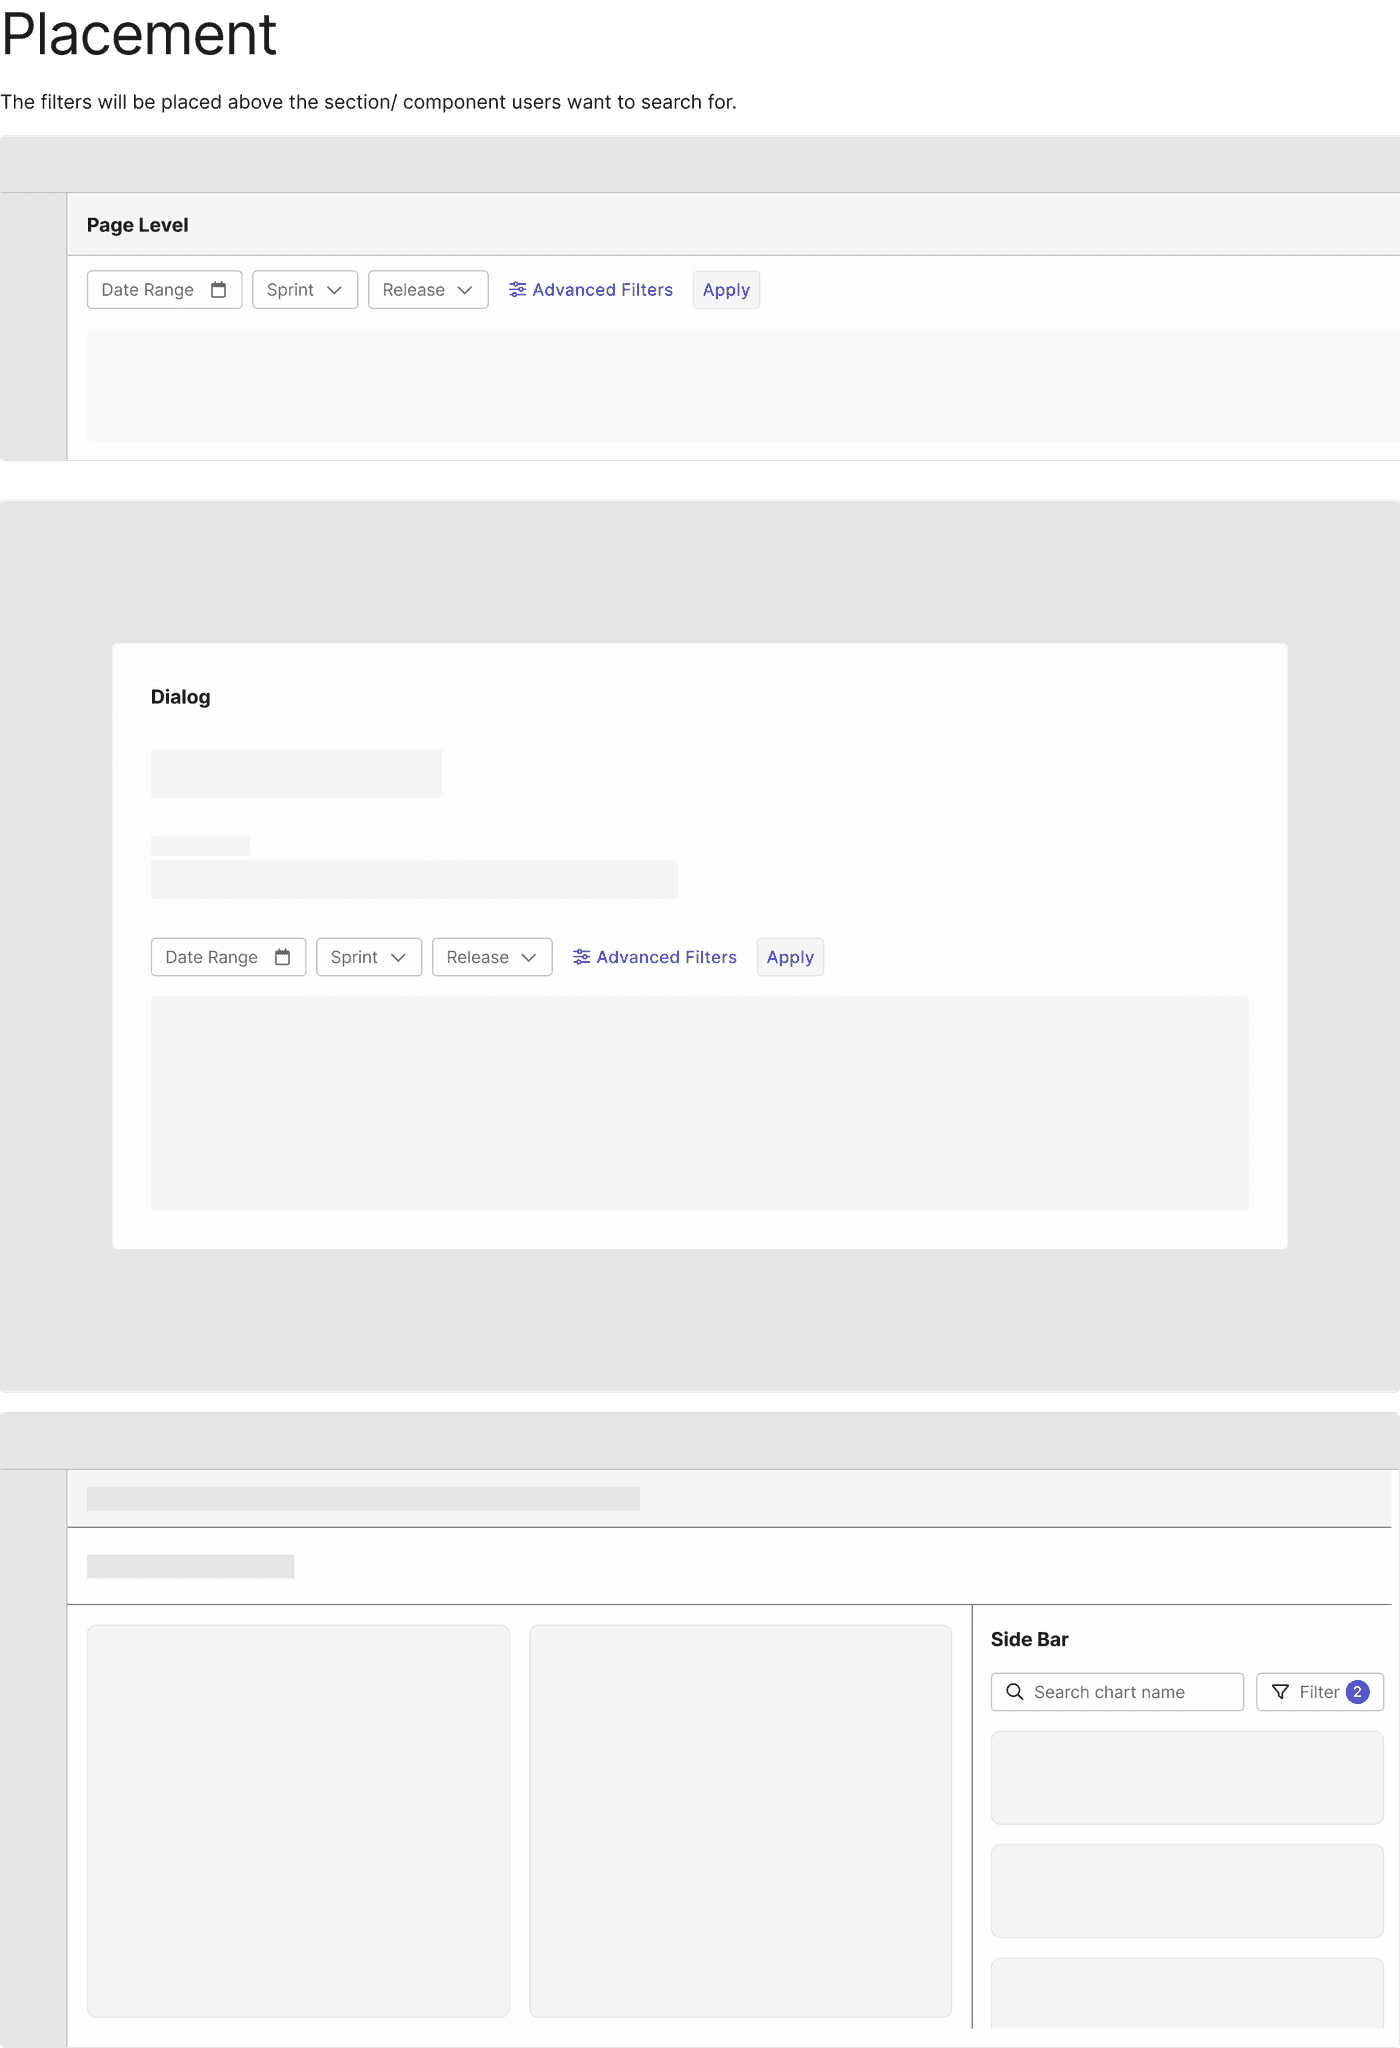
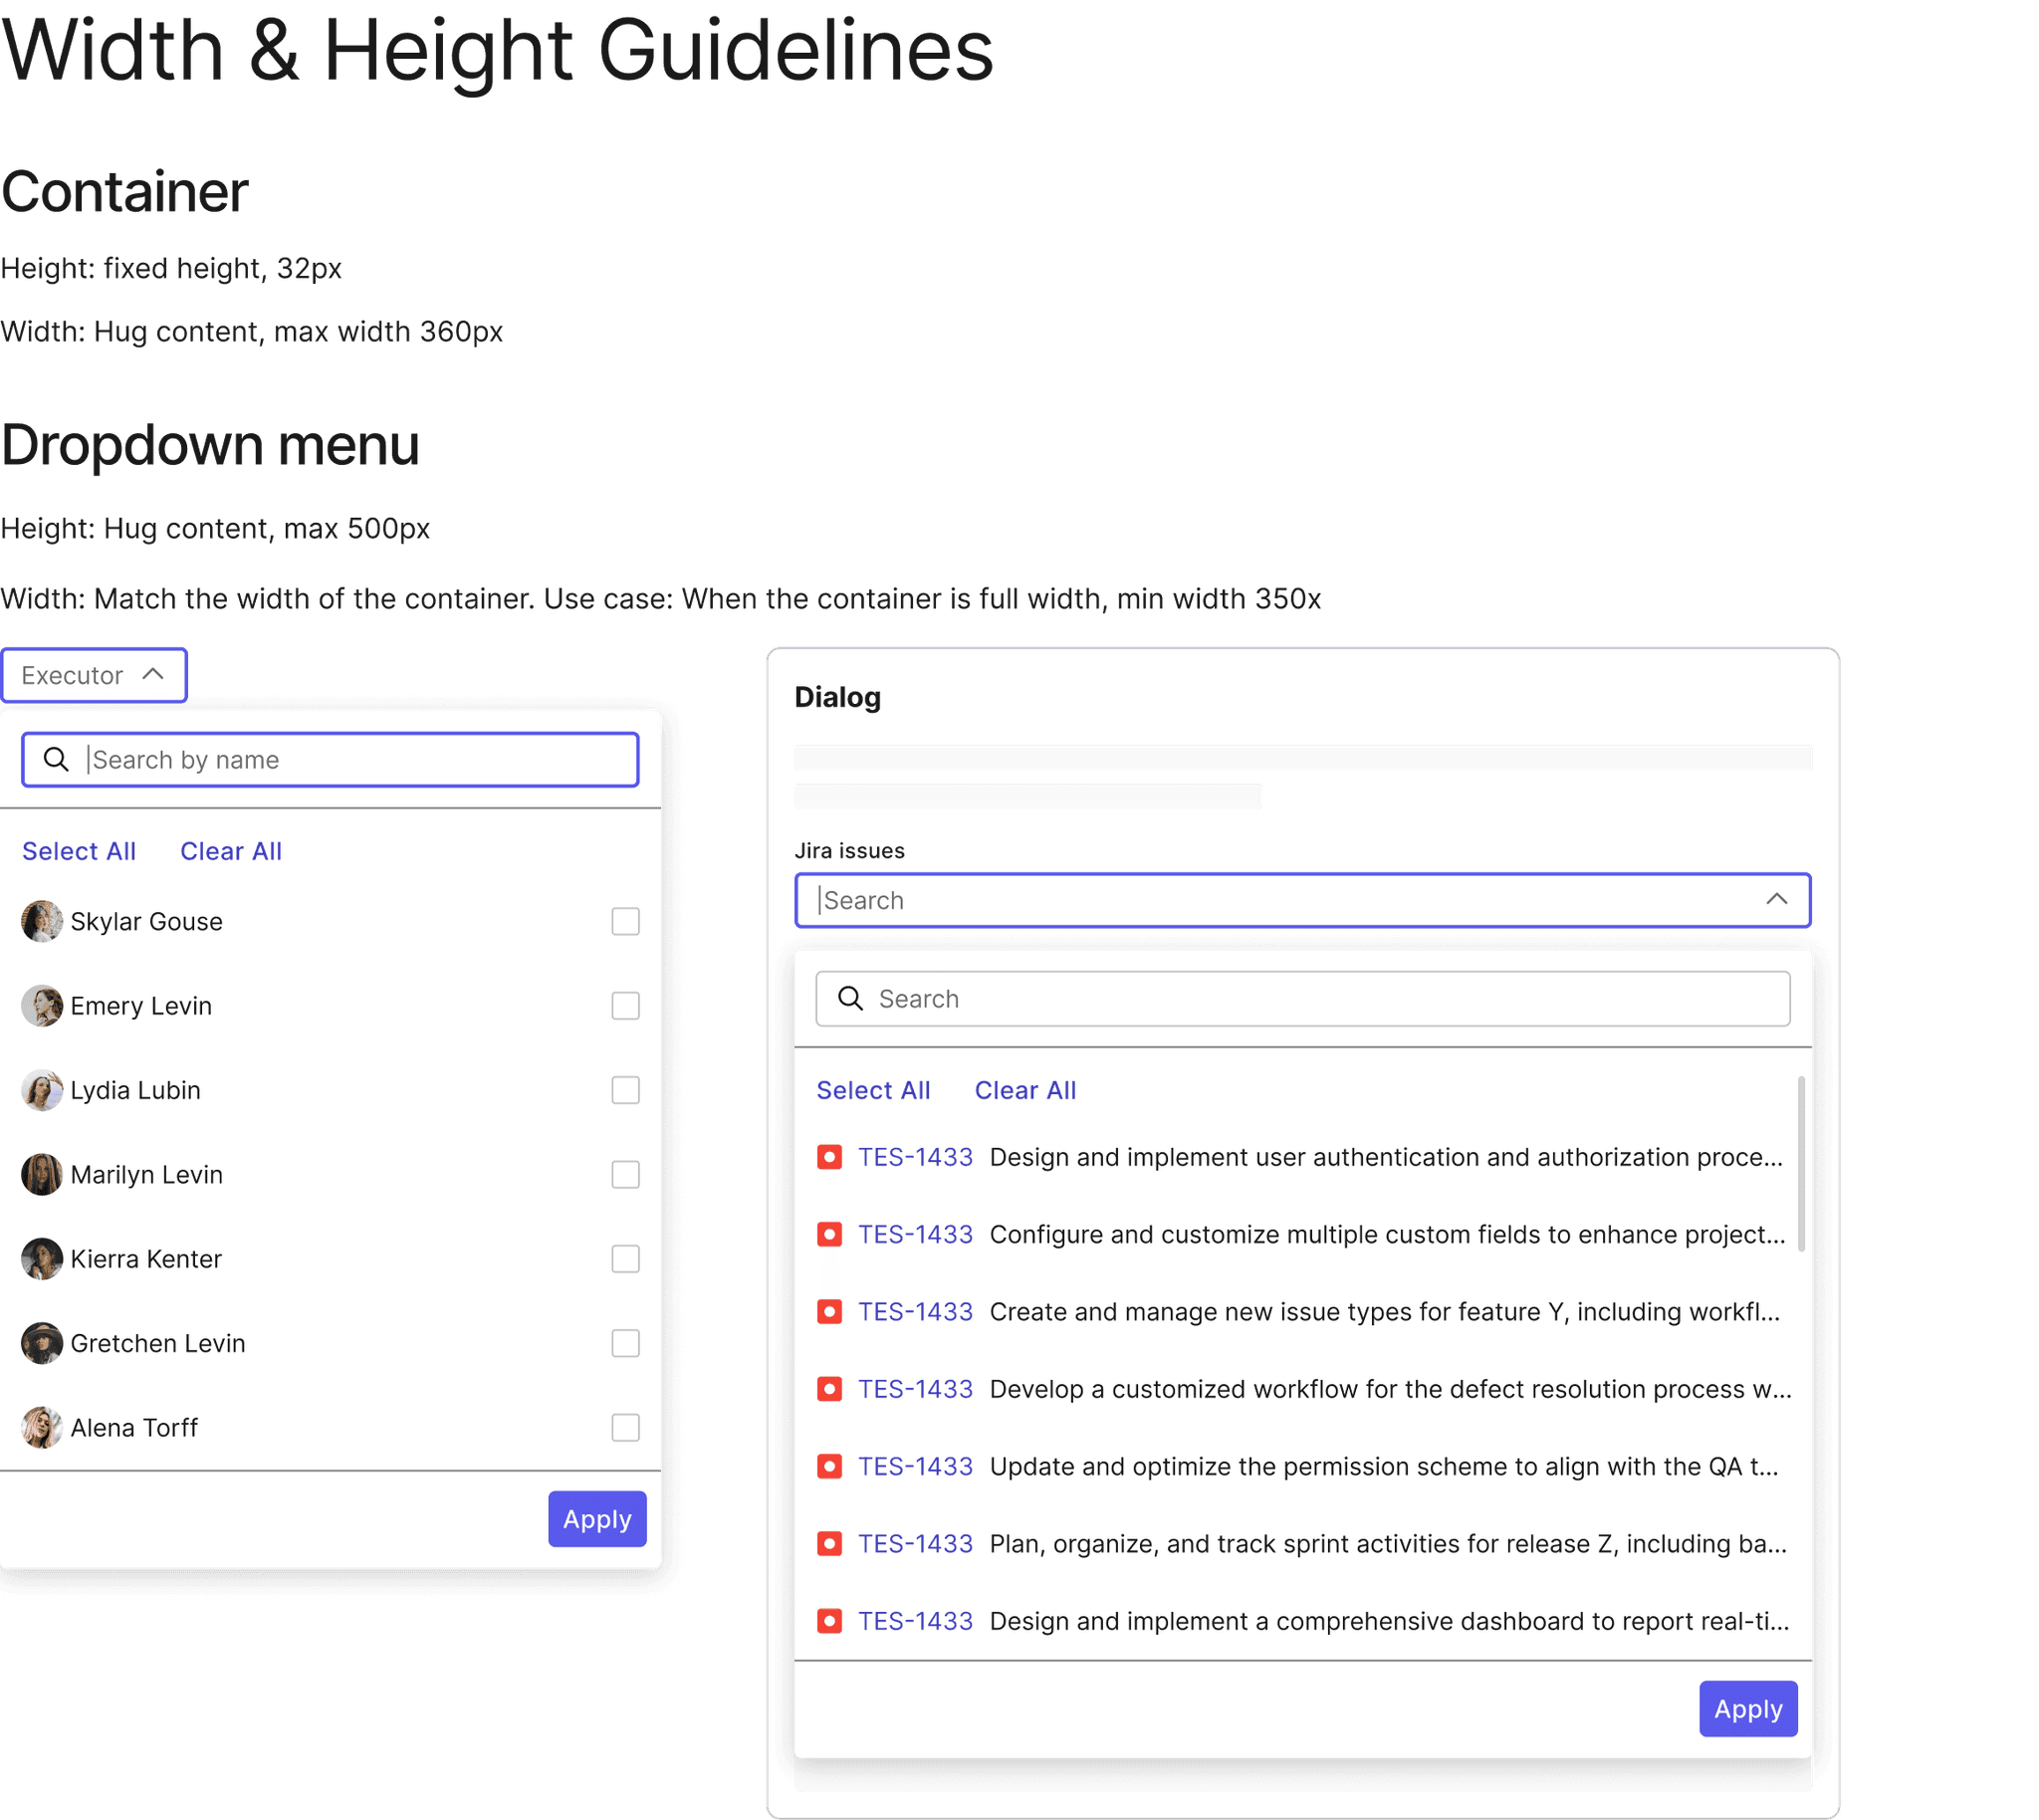
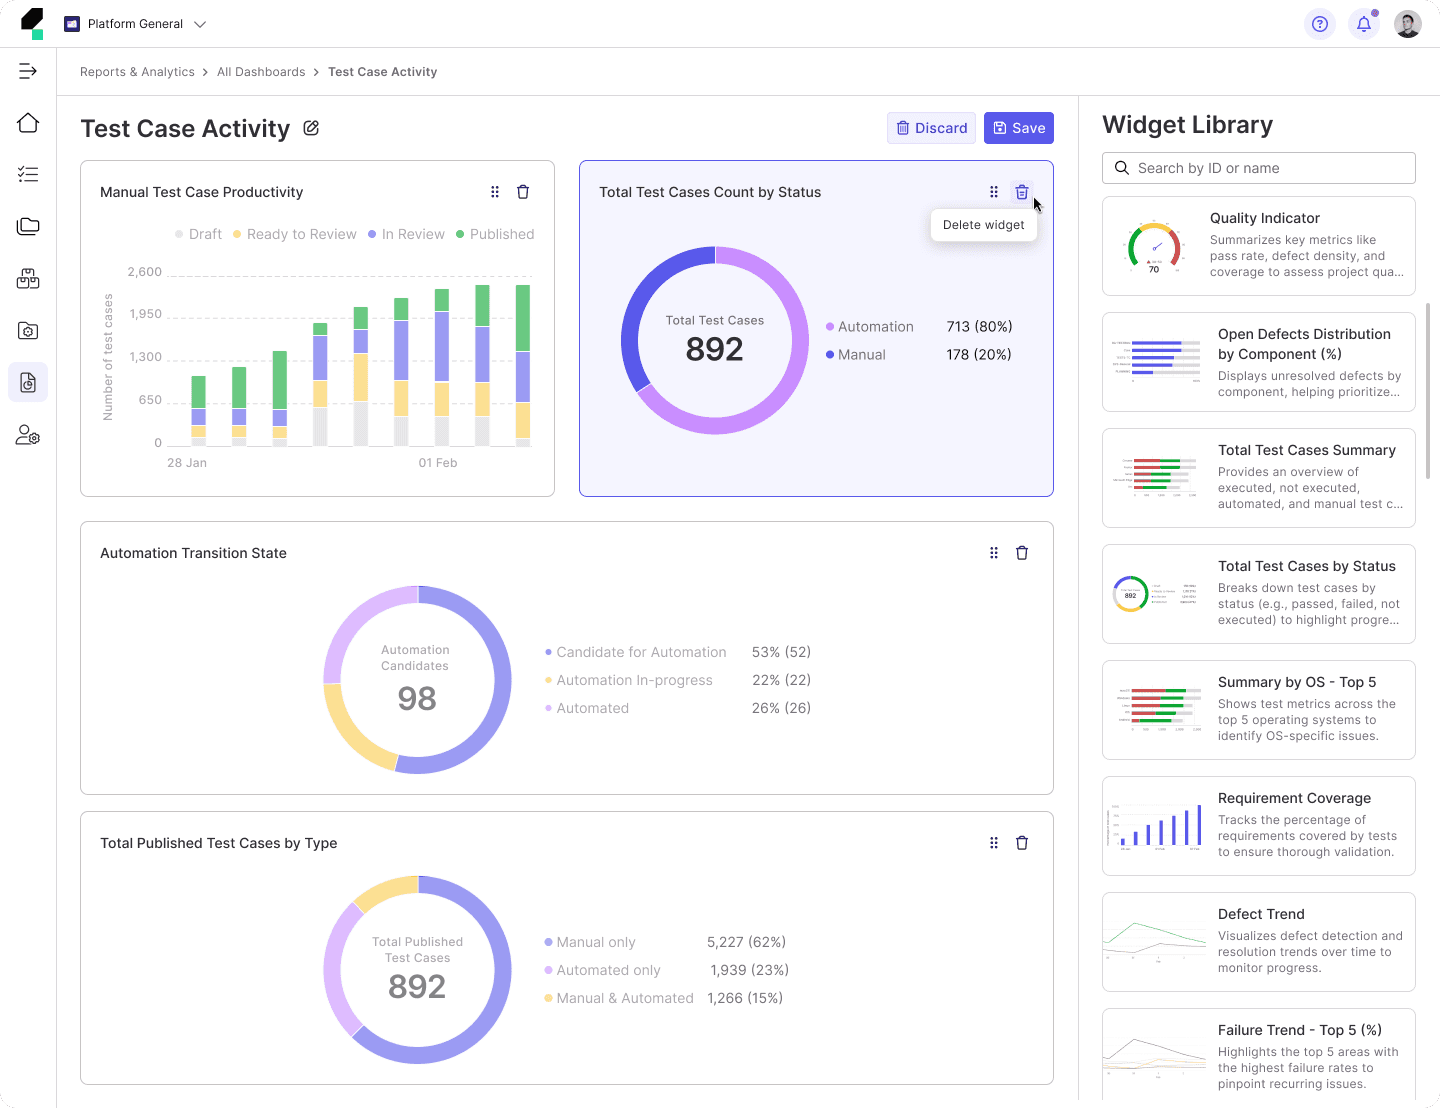
Define the New Filtering Pattern
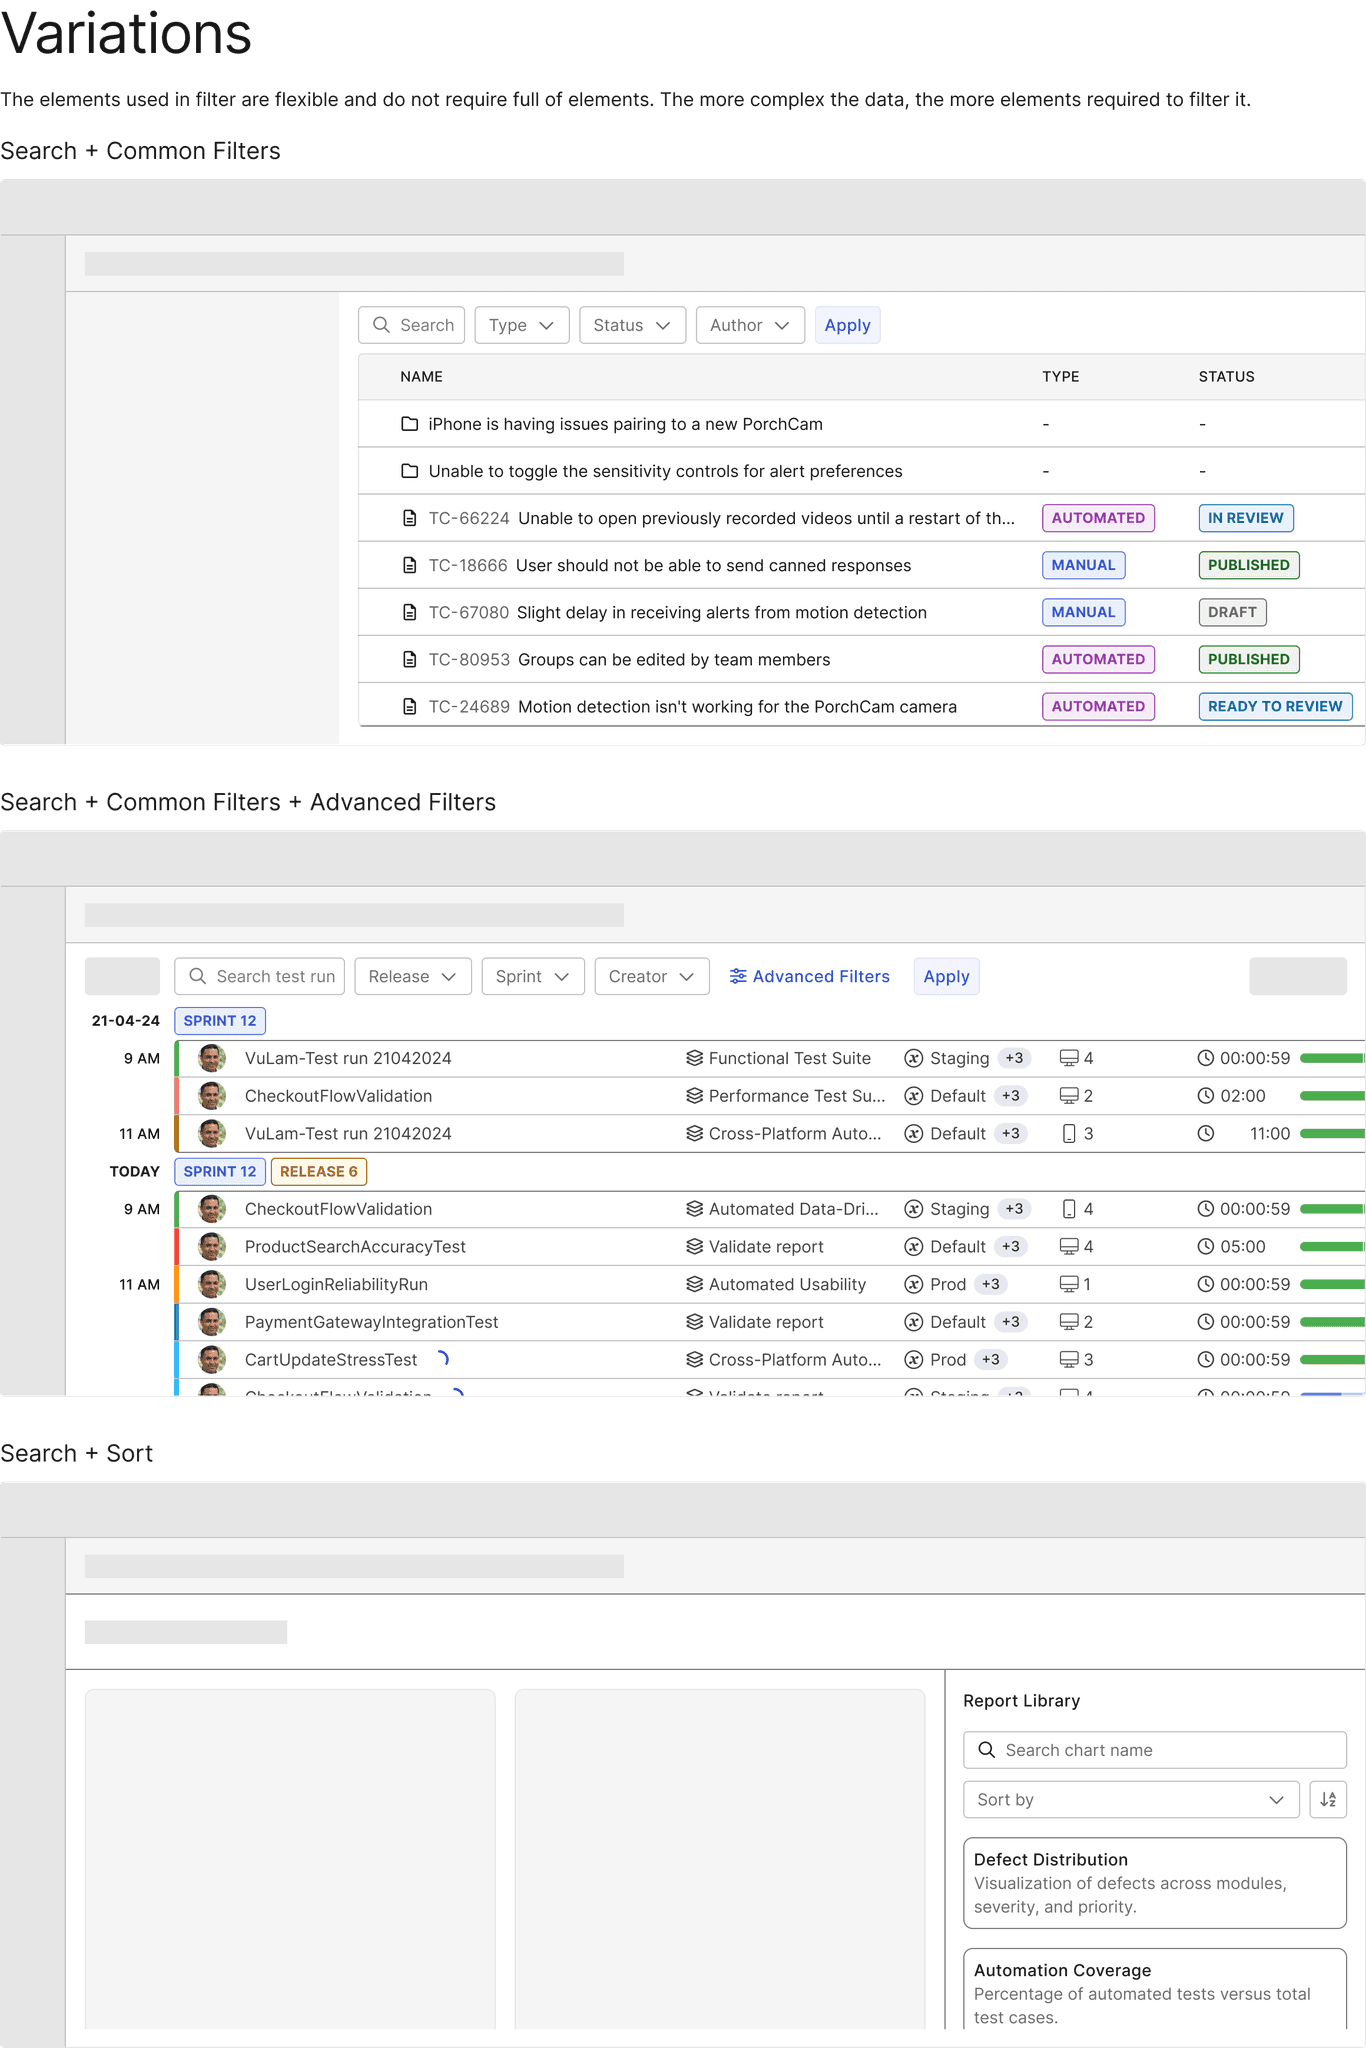
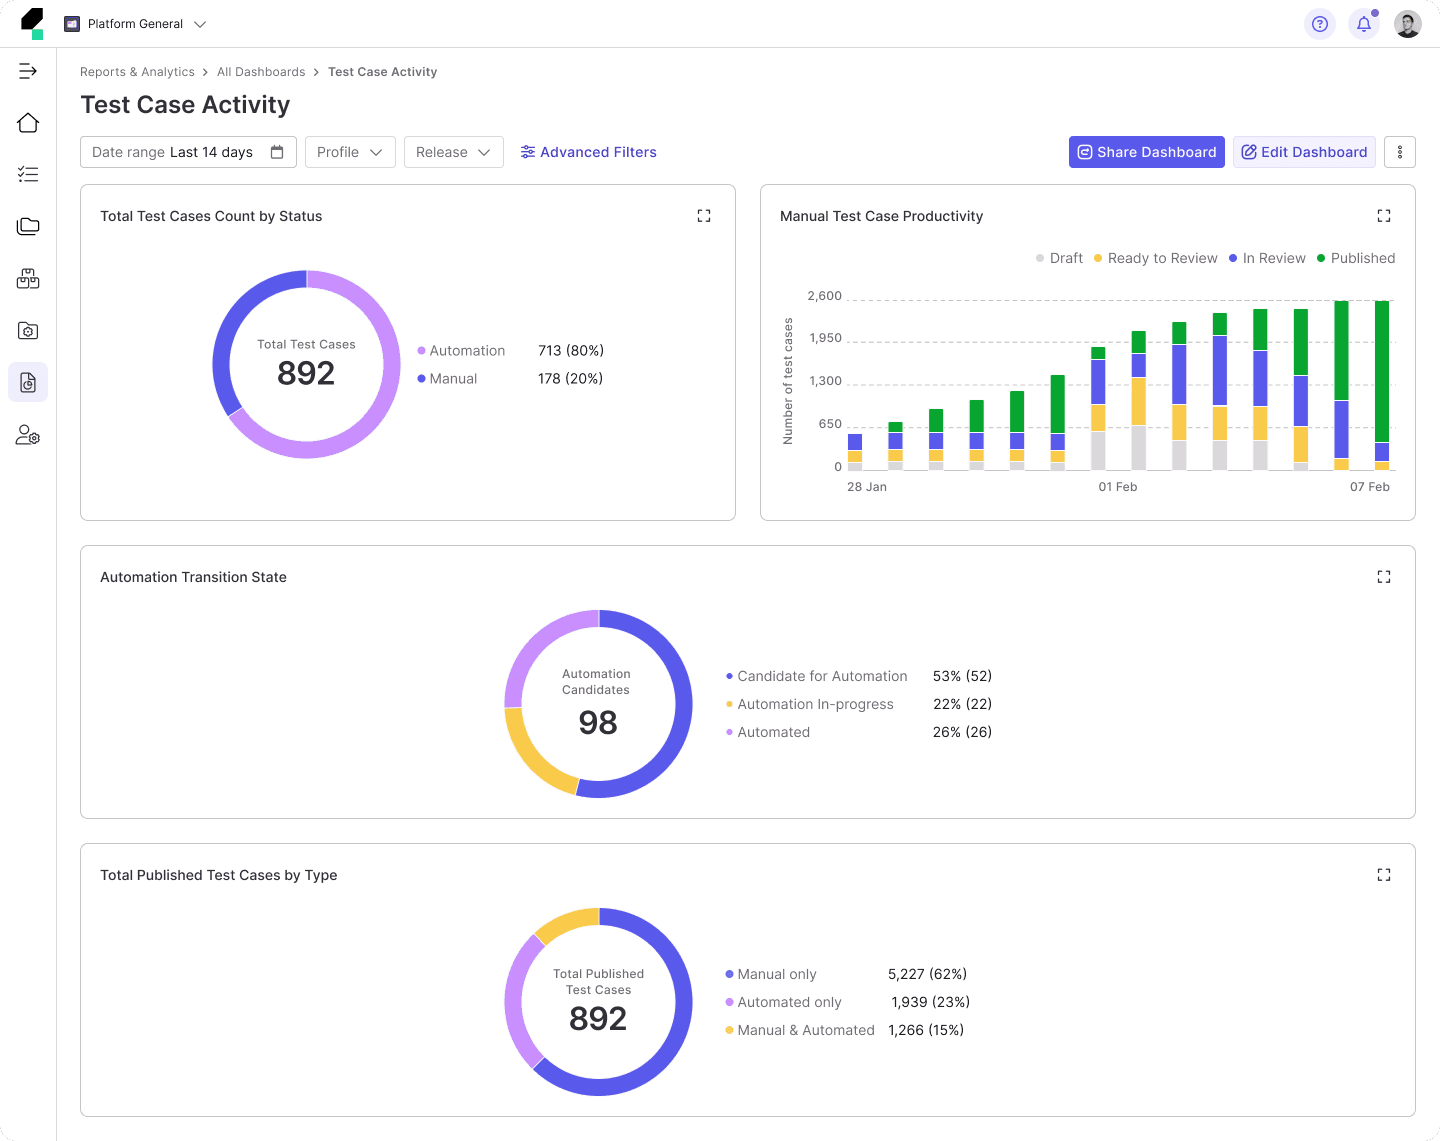
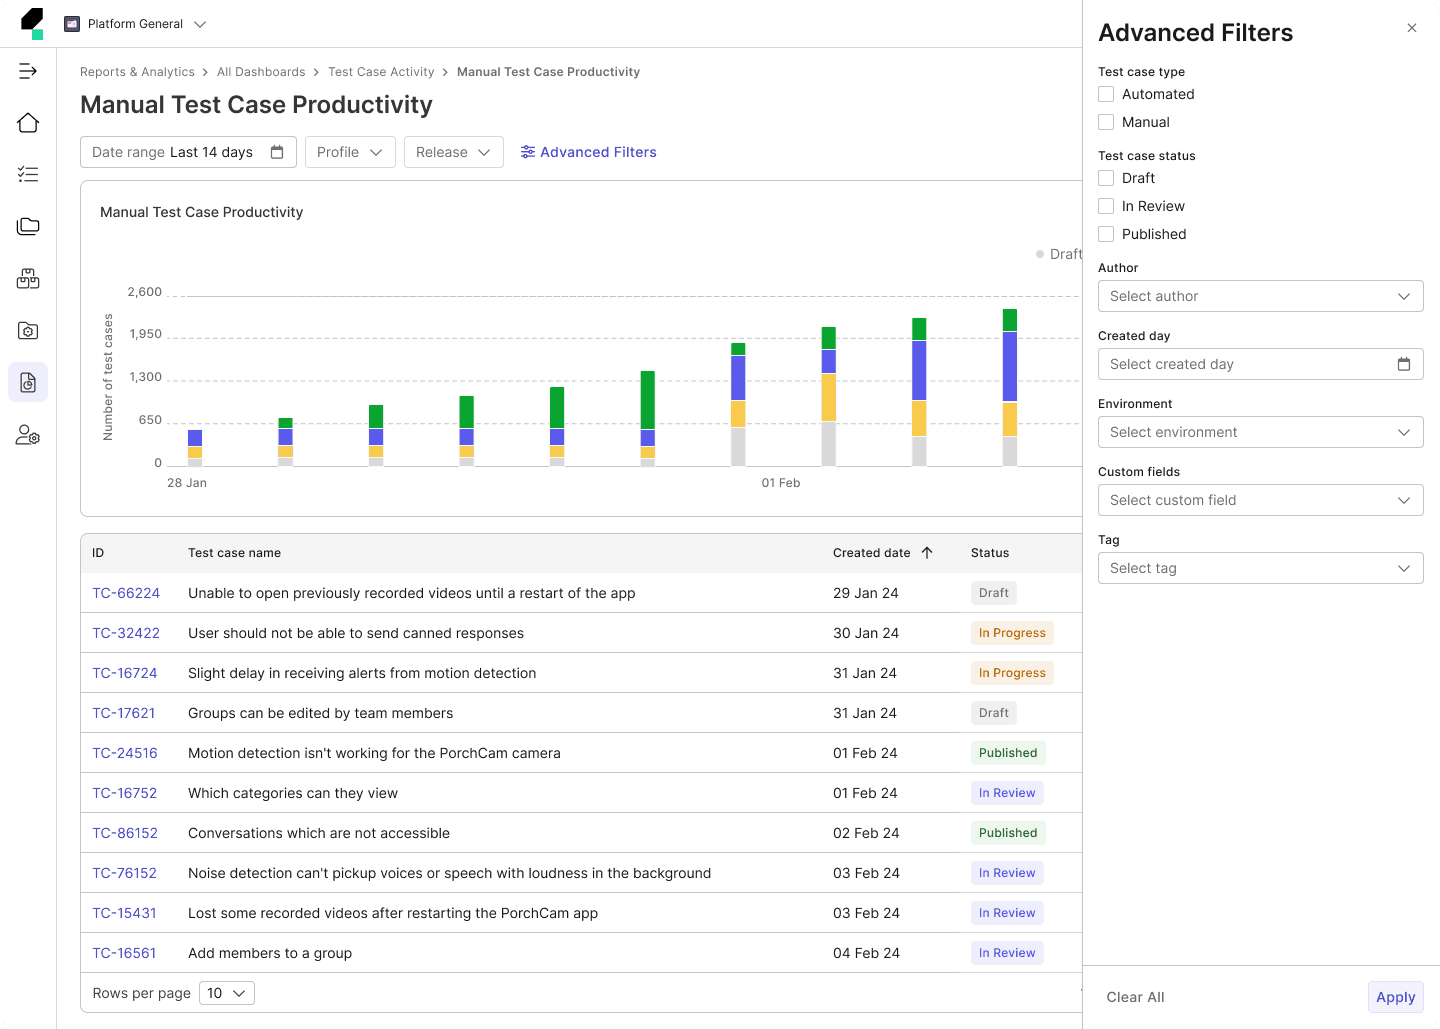
With the insights I gathered, combined with our use cases, I began defining the new filtering pattern. I shifted from instant filtering to batch filtering, allowing users to apply multiple conditions before updating the report. This approach ensured that filtering actions did not disrupt the user experience by keeping the chart in focus rather than shifting it down the page.
Prototype & Validate
I created wireframes and interactive prototypes to visualize the new filtering experience, helping to communicate the design and functionality effectively. To ensure the new pattern improved both efficiency and user satisfaction, I conducted usability testing with our internal users, gathering valuable insights.
Additionally, I collaborated closely with stakeholders, including designers, product managers, and engineers, to gather feedback, which was then used to refine and improve the solution before final implementation.
Document & Implement
I developed design documentation that outlined the filtering behavior, interaction patterns, and best practices to ensure consistency and clarity across the team. After the launch, I closely monitored user feedback to identify any areas for improvement, making further refinements to ensure the filtering experience was as seamless and efficient as possible.
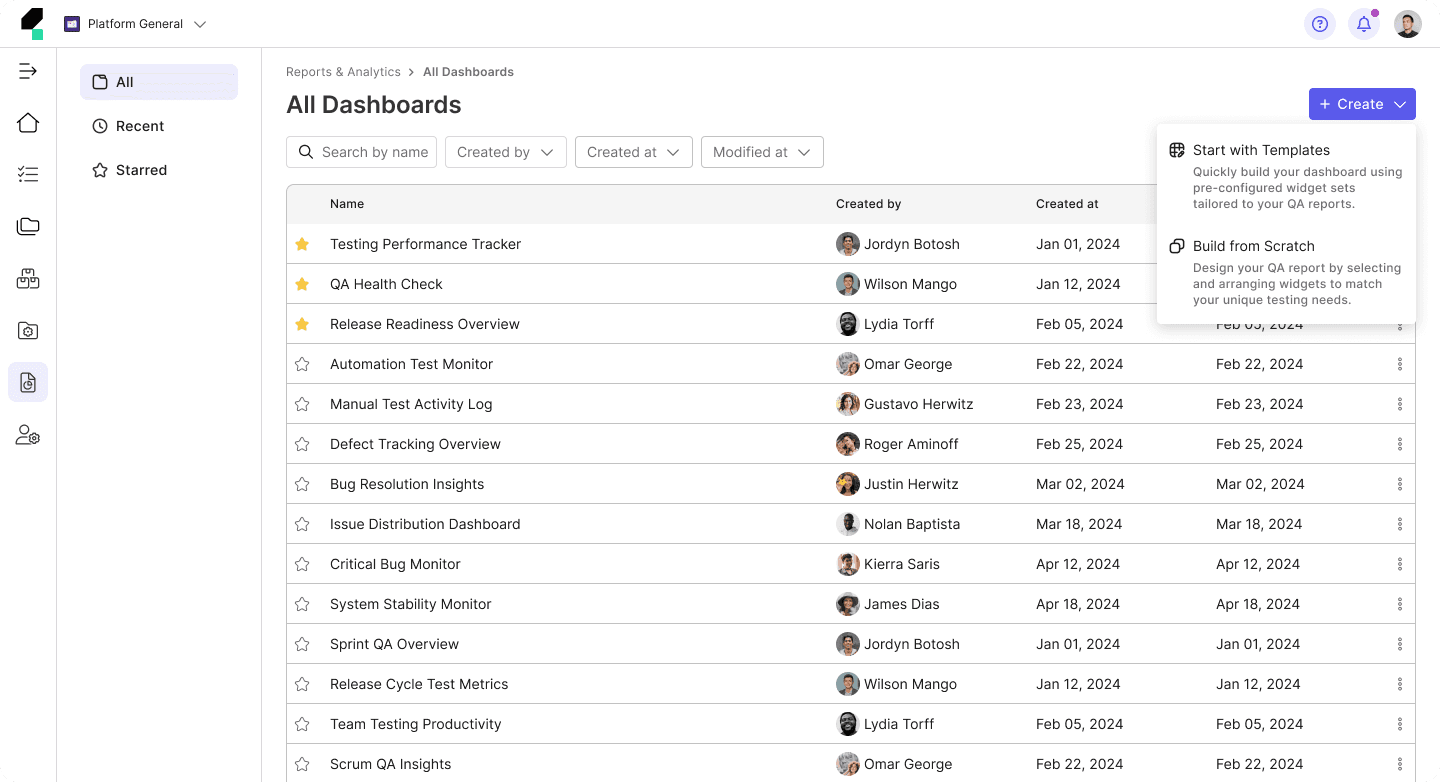
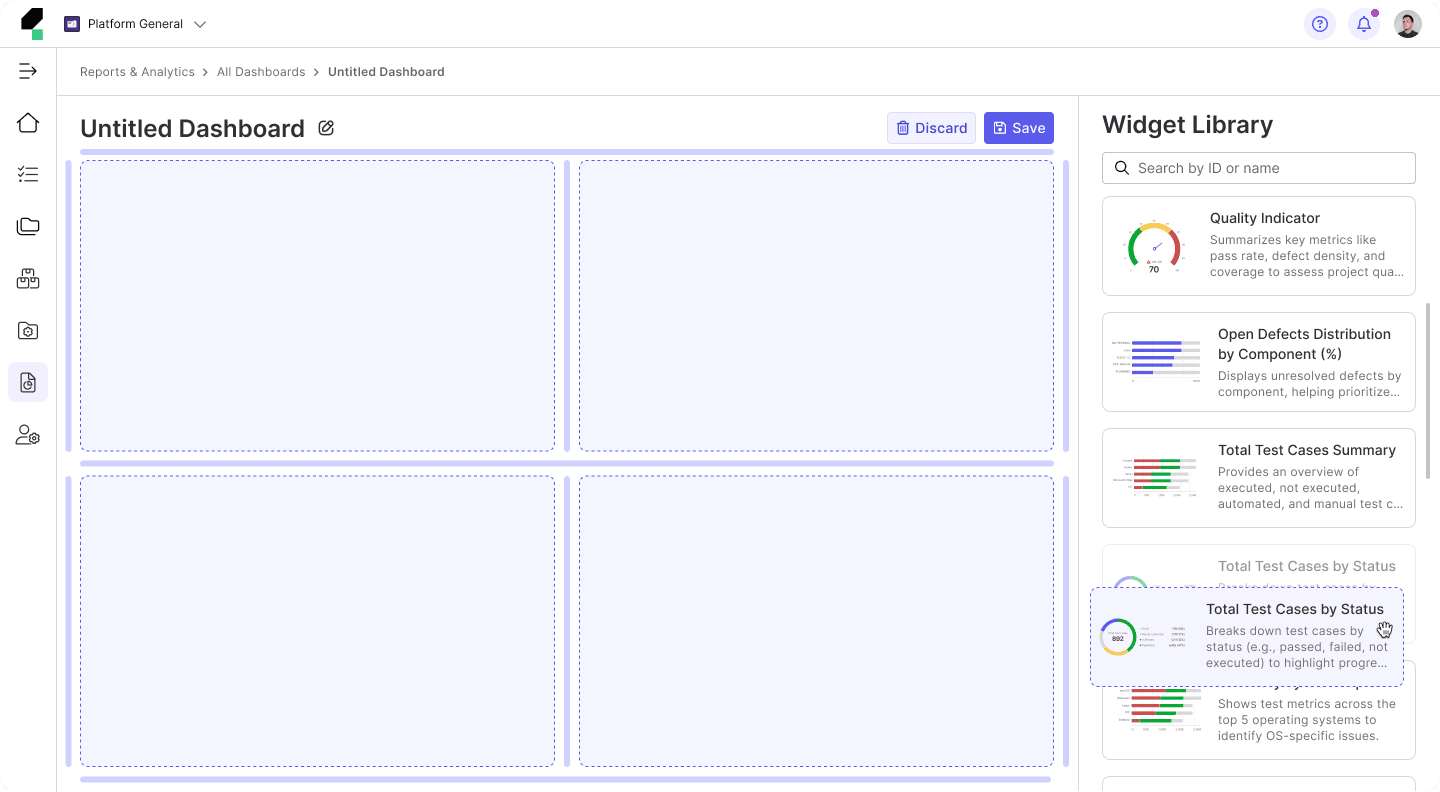
Final Outcome


Xuan Hao Mai - Product Designer